Generate load
To observe KEDA scale the deployment in response to the KEDA ScaledObject we have configured, we need to generate some load on our application. We'll do that by calling the home page of the workload with hey.
The command below will run the load generator with:
- 3 workers running concurrently
- Sending 5 queries per second each
- Running for a maximum of 10 minutes
Based on the ScaledObject, KEDA creates an HPA resource and provides the required metrics to allow the HPA to scale the workload. Now that we have requests hitting our application we can watch the HPA resource to follow its progress:
NAME REFERENCE TARGETS MINPODS MAXPODS REPLICAS AGE
keda-hpa-ui-hpa Deployment/ui 7/100 (avg) 1 10 1 7m58s
keda-hpa-ui-hpa Deployment/ui 778/100 (avg) 1 10 1 8m33s
keda-hpa-ui-hpa Deployment/ui 194500m/100 (avg) 1 10 4 8m48s
keda-hpa-ui-hpa Deployment/ui 97250m/100 (avg) 1 10 8 9m3s
keda-hpa-ui-hpa Deployment/ui 625m/100 (avg) 1 10 8 9m18s
keda-hpa-ui-hpa Deployment/ui 91500m/100 (avg) 1 10 8 9m33s
keda-hpa-ui-hpa Deployment/ui 92125m/100 (avg) 1 10 8 9m48s
keda-hpa-ui-hpa Deployment/ui 750m/100 (avg) 1 10 8 10m
keda-hpa-ui-hpa Deployment/ui 102625m/100 (avg) 1 10 8 10m
keda-hpa-ui-hpa Deployment/ui 113625m/100 (avg) 1 10 8 11m
keda-hpa-ui-hpa Deployment/ui 90900m/100 (avg) 1 10 10 11m
keda-hpa-ui-hpa Deployment/ui 91500m/100 (avg) 1 10 10 12m
Once you're satisfied with the autoscaling behavior, you can end the watch with Ctrl+C and stop the load generator like so:
As the load generator terminates, notice that the HPA will slowly bring the replica count to min number based on its configuration.
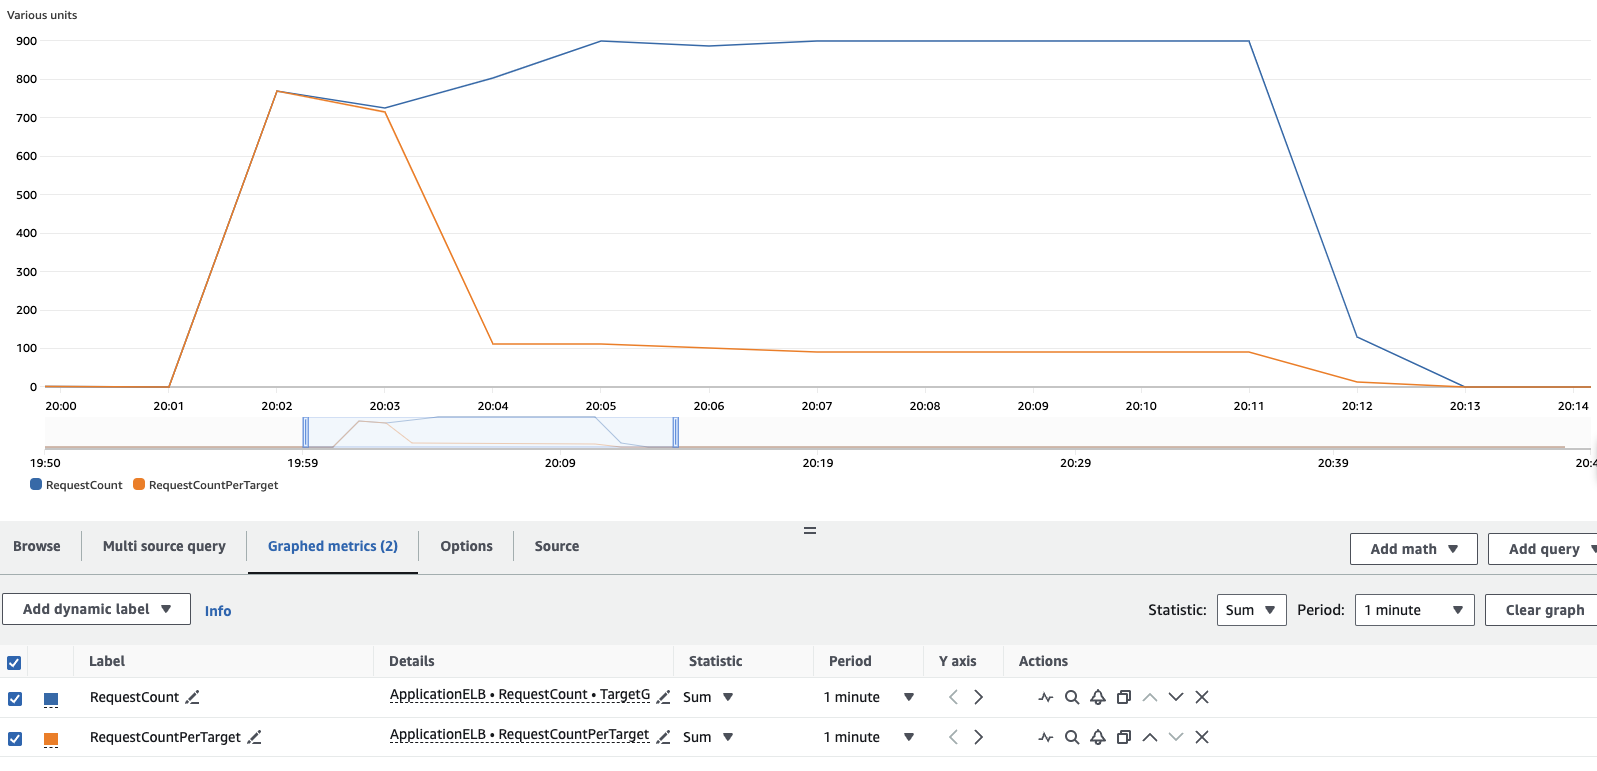
You can also view the load test results in the CloudWatch console:
 Open CloudWatch console
To reproduce this graph in your account, from the cloudwatch metrics console, you'll need to add 2 metrics and configure accordingly the graph:
- Under Metrics, ensure you're in the same region as your cluster.
- Under ApplicationELB > Per AppELB Metrics, per TG Metrics, select
RequestCountandRequestCountPerTarget - Click on the Graphed Metrics (2) tab, for each metrics
- Change Statistic from
AveragetoSum - Change Period from
5 minutesto1 minute
- Change Statistic from
From the results you can see that initially all of the load was handled by a single pod, but as KEDA begins to scale the workload the requests are distributed across the additional pods added to the workload as they become valid target in the load balancer target group. If you let the load-generator pod run for the full 10 minutes, you'll see results similar to this.