アプリケーションメトリクス
このセクションでは、ワークロードによって公開されているメトリクスの洞察を得て、Amazon CloudWatch Insights Prometheusを使用してこれらのメトリクスを可視化する方法を見ていきます。これらのメトリクスの例としては以下のようなものがあります:
- Javaヒープメトリクスやデータベース接続プールのステータスなどのシステムメトリクス
- ビジネスKPIに関連するアプリケーションメトリクス
AWS Distro for OpenTelemetryを使用してアプリケーションメトリクスを取り込み、Amazon CloudWatchを使用してメトリクスを可視化する方法を見てみましょう。
このワークショップの各コンポーネントは、特定のプログラミング言語やフレームワークに関連するライブラリを使用してPrometheusメトリクスを提供するように計装されています。ordersサービスからのこれらのメトリクスの例を次のように見ることができます:
[...]
# HELP jdbc_connections_idle Number of established but idle connections.
# TYPE jdbc_connections_idle gauge
jdbc_connections_idle{name="reader",} 10.0jdbc_connections_idle{name="writer",} 10.0[...]
# HELP watch_orders_total The number of orders placed
# TYPE watch_orders_total counter
watch_orders_total{productId="510a0d7e-8e83-4193-b483-e27e09ddc34d",} 2.0watch_orders_total{productId="808a2de1-1aaa-4c25-a9b9-6612e8f29a38",} 1.0watch_orders_total{productId="*",} 3.0watch_orders_total{productId="6d62d909-f957-430e-8689-b5129c0bb75e",} 1.0このコマンドの出力は詳細ですが、このラボのためにwatch_orders_totalメトリクスに焦�点を当てましょう:
watch_orders_total- アプリケーションメトリクス - 小売店を通じて何件の注文が行われたか
同様のリクエストを他のコンポーネント、例えばcheckoutサービスに実行できます:
[...]
# HELP nodejs_heap_size_total_bytes Process heap size from Node.js in bytes.
# TYPE nodejs_heap_size_total_bytes gauge
nodejs_heap_size_total_bytes 48668672
[...]
すでにデプ��ロイしたコレクターはDaemonSetであり、すべてのノードで実行されていることを思い出してください。クラスター内のPodからメトリクスをスクレイピングする場合、これは重複したメトリクスが発生するため望ましくありません。今回は、単一のレプリカを持つDeploymentとして実行される2番目のコレクターをデプロイします。
完全なコレクターマニフェストを展開
apiVersion: opentelemetry.io/v1beta1
kind: OpenTelemetryCollector
metadata:
  name: adot-container-ci-deploy
  namespace: other
spec:
  image: public.ecr.aws/aws-observability/aws-otel-collector:v0.40.0
  mode: deployment
  serviceAccount: adot-collector-ci
  config:
    receivers:
      prometheus:
        config:
          global:
            scrape_interval: 60s
            scrape_timeout: 15s
            external_labels:
              cluster: ${EKS_CLUSTER_NAME}
              account_id: ${AWS_ACCOUNT_ID}
              region: ${AWS_REGION}
          scrape_configs:
            - job_name: "kubernetes-pods"
              honor_labels: true

              kubernetes_sd_configs:
                - role: pod
              relabel_configs:
                - source_labels:
                    [__meta_kubernetes_pod_annotation_prometheus_io_scrape]
                  action: keep
                  regex: true
                - source_labels:
                    [__meta_kubernetes_pod_annotation_prometheus_io_scrape_slow]
                  action: drop
                  regex: true
                - source_labels:
                    [__meta_kubernetes_pod_annotation_prometheus_io_scheme]
                  action: replace
                  regex: (https?)
                  target_label: __scheme__
                - source_labels:
                    [__meta_kubernetes_pod_annotation_prometheus_io_path]
                  action: replace
                  target_label: __metrics_path__
                  regex: (.+)
                - action: labelmap
                  regex: __meta_kubernetes_pod_annotation_prometheus_io_param_(.+)
                  replacement: __param_$$1
                - action: labelmap
                  regex: __meta_kubernetes_pod_label_(.+)
                - source_labels: [__meta_kubernetes_namespace]
                  action: replace
                  target_label: namespace
                - source_labels: [__meta_kubernetes_pod_name]
                  action: replace
                  target_label: pod
                - source_labels: [__meta_kubernetes_pod_phase]
                  regex: Pending|Succeeded|Failed|Completed
                  action: drop

    processors:
      batch/metrics:
        timeout: 60s

    exporters:
      awsemf/prometheus:
        namespace: ContainerInsights/Prometheus
        log_group_name: "/aws/containerinsights/${EKS_CLUSTER_NAME}/prometheus"
        log_stream_name: "${K8S_POD_NAME}"
        region: ${AWS_REGION}
        resource_to_telemetry_conversion:
          enabled: true
        dimension_rollup_option: NoDimensionRollup
        metric_declarations:
          - dimensions: [[pod, productId]]
            metric_name_selectors:
              - "^watch_orders_total$"

    extensions:
      health_check: {}

    service:
      pipelines:
        metrics:
          receivers: [prometheus]
          processors: [batch/metrics]
          exporters: [awsemf/prometheus]
      extensions: [health_check]

  env:
    - name: K8S_NODE_NAME
      valueFrom:
        fieldRef:
          fieldPath: spec.nodeName
    - name: HOST_IP
      valueFrom:
        fieldRef:
          fieldPath: status.hostIP
    - name: HOST_NAME
      valueFrom:
        fieldRef:
          fieldPath: spec.nodeName
    - name: K8S_NAMESPACE
      valueFrom:
        fieldRef:
          fieldPath: metadata.namespace
    - name: "K8S_POD_NAME"
      valueFrom:
        fieldRef:
          fieldPath: "metadata.name"
これをいくつかの部分に分けて確認することで、より理解しやすくなります。
  image: public.ecr.aws/aws-observability/aws-otel-collector:v0.40.0
  mode: deployment
前述の通り、今回はDeploymentを使用しています。
次にコレクター構成自体の内容を見ていきましょう。
  config:
    receivers:
      prometheus:
        config:
          global:
            scrape_interval: 60s
            scrape_timeout: 15s
            external_labels:
              cluster: ${EKS_CLUSTER_NAME}
              account_id: ${AWS_ACCOUNT_ID}
              region: ${AWS_REGION}
          scrape_configs:
            - job_name: "kubernetes-pods"
              honor_labels: true

              kubernetes_sd_configs:
                - role: pod
              relabel_configs:
                - source_labels:
                    [__meta_kubernetes_pod_annotation_prometheus_io_scrape]
                  action: keep
                  regex: true
                - source_labels:
                    [__meta_kubernetes_pod_annotation_prometheus_io_scrape_slow]
                  action: drop
                  regex: true
                - source_labels:
                    [__meta_kubernetes_pod_annotation_prometheus_io_scheme]
                  action: replace
                  regex: (https?)
                  target_label: __scheme__
                - source_labels:
                    [__meta_kubernetes_pod_annotation_prometheus_io_path]
                  action: replace
                  target_label: __metrics_path__
                  regex: (.+)
                - action: labelmap
                  regex: __meta_kubernetes_pod_annotation_prometheus_io_param_(.+)
                  replacement: __param_$$1
                - action: labelmap
                  regex: __meta_kubernetes_pod_label_(.+)
                - source_labels: [__meta_kubernetes_namespace]
                  action: replace
                  target_label: namespace
                - source_labels: [__meta_kubernetes_pod_name]
                  action: replace
                  target_label: pod
                - source_labels: [__meta_kubernetes_pod_phase]
                  regex: Pending|Succeeded|Failed|Completed
                  action: drop
AWS Container Insights Receiverではなく、Prometheusレシーバーを使用してEKSクラスター内のすべてのポッドをスクレイプします。
    processors:
      batch/metrics:
        timeout: 60s
前回のコレクターと同じバッチプロセッサーを使用します。
      awsemf/prometheus:
        namespace: ContainerInsights/Prometheus
        log_group_name: "/aws/containerinsights/${EKS_CLUSTER_NAME}/prometheus"
        log_stream_name: "${K8S_POD_NAME}"
        region: ${AWS_REGION}
        resource_to_telemetry_conversion:
          enabled: true
        dimension_rollup_option: NoDimensionRollup
        metric_declarations:
          - dimensions: [[pod, productId]]
            metric_name_selectors:
              - "^watch_orders_total$"
AWS CloudWatch EMF Exporter for OpenTelemetry Collectorを使用しますが、今回はContainerInsights/Prometheusという名前空間を使用します。
      pipelines:
        metrics:
          receivers: [prometheus]
          processors: [batch/metrics]
          exporters: [awsemf/prometheus]
前回と同様に、これらをパイプラインにまとめます。
上記で確認したリソースを作成します:
コレクターが実行されていることを、DaemonSetによって作成されたPodを調査することで確認できます:
NAME READY STATUS RESTARTS AGE
adot-container-ci-deploy-collector-5lp5g 1/1 Running 0 15s
これで設定が完了しましたので、以下のスクリプトを使用して負荷ジェネレーターを実行し、ストアに注文を行い、アプリケーションメトリクスを生成します:
CloudWatchコンソールを開いて、ダッシュボードセクションに移動します:
 CloudWatchコンソールを開く
ダッシュボードOrder-Service-Metricsを選択して、ダッシュボード内のパネルを確認します:

「Orders by Product」パネルのタイトルにカーソルを合わせて「Edit」ボタンをクリックすることで、ダッシュボードがCloudWatchをクエリするように構成されている方法を確認できます:
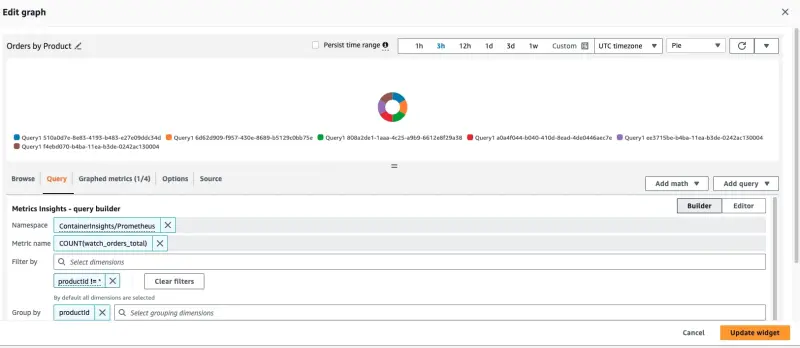
このパネルを作成するために使用されたクエリはページの下部に表示されます:
SELECT COUNT(watch_orders_total) FROM "ContainerInsights/Prometheus" WHERE productId != '*' GROUP BY productId
このクエリは以下のことを行っています:
watch_orders_totalメトリクスをクエリするproductIdの値が*のメトリクスを無視する- これらのメトリクスを合計し、
productIdでグループ化する
メトリクスの観察に満足したら、以下のコマンドを使用して負荷ジェネレーターを停止できます。